orhtej2@eviltoast.org to Dank Memes@lemmy.worldEnglish · 1 month agoReduce the trafficeviltoast.orgexternal-linkmessage-square24fedilinkarrow-up1348arrow-down111cross-posted to: [email protected]
arrow-up1337arrow-down1external-linkReduce the trafficeviltoast.orgorhtej2@eviltoast.org to Dank Memes@lemmy.worldEnglish · 1 month agomessage-square24fedilinkcross-posted to: [email protected]
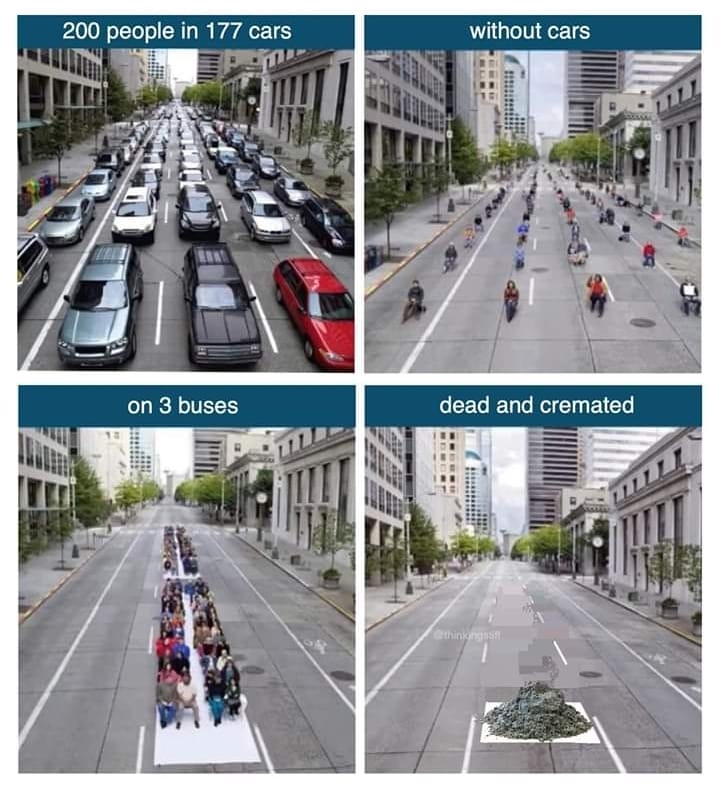
minus-squarebryndos@fedia.iolinkfedilinkarrow-up3·1 month agoInteresting dynamic is that I think bus occupancy tends to scales up with demand, i.e. at rush hour. Car occupancy less so (i think). I don’t know the answer - but I expect occupancy at peak travel times is of most interest. I don’t really think averages are that useful though, the whole system context is important. These diagrams are just stupid memes.


Interesting dynamic is that I think bus occupancy tends to scales up with demand, i.e. at rush hour. Car occupancy less so (i think).
I don’t know the answer - but I expect occupancy at peak travel times is of most interest.
I don’t really think averages are that useful though, the whole system context is important. These diagrams are just stupid memes.